


Weather radar guide
PocketRadarWhat weather radar colors really mean.
Colors show ranges of radar reflectivity, not a universal promise of rain rate or precipitation type. Start with the legend, read the dBZ range, then check motion and local conditions.
The short answer
Weather radar colors represent ranges of reflectivity measured in dBZ. Higher dBZ means a stronger signal returned to the radar, which often accompanies heavier precipitation, but the exact colors vary by app and product. Always use the legend shown on that map.
Read the map's legend before naming a color.
There is no single worldwide rule that green always means light rain or red always means a specific rain rate. Apps, radar products, and clear-air or precipitation modes can use different scales. Match the pixel on the map to the legend displayed beside it.
Colors visualize reflectivity, not drops at the ground.
Reflectivity is the amount of transmitted radar energy returned to the receiver. Larger, more numerous, or water-coated targets can return more energy. dBZ puts that wide range on a logarithmic scale that is easier to compare.
A strong return can be important, but color alone does not identify every target or prove exactly what is reaching the surface.
Use dBZ ranges as clues, not guarantees.
For one U.S. National Weather Service WSR-88D reference, about 20 dBZ corresponds to trace rainfall, 30 dBZ to roughly 0.10 inch per hour, 41 dBZ to about 0.50 inch per hour, and 55 dBZ to about 4 inches per hour. Those are approximate relationships for that product, not universal promises.
Hail, melting snow, beam height, and other effects can make a return look stronger or weaker than surface rainfall suggests.
Compare color across time, not just one frame.
Play the loop and follow the same area through several scans. A growing area of stronger reflectivity tells a different story from one bright pixel that disappears immediately. Watch the shape, direction, and persistence together.
Confirm severe or safety-critical decisions elsewhere.
Radar colors cannot by themselves prove hail, tornadoes, flooding, or what is happening at street level. Check official warnings, current observations, and local instructions. For a complete reading sequence, use the five-step weather radar guide.
A practical reflectivity reference
Illustrative U.S. WSR-88D values.
| Reflectivity | Common interpretation | What to remember |
|---|---|---|
| Around 20 dBZ | Very weak return; trace rain in the cited NWS table | May be aloft and not reach the surface |
| Around 30-36 dBZ | Light to moderate rain reference | Compare with the map legend and nearby observations |
| Around 41-47 dBZ | Stronger return; heavier rain reference | Rate estimates vary with storm structure and motion |
| 50 dBZ and above | Very strong return, sometimes thunderstorms or hail | Do not diagnose severe weather from color alone |
A different palette does not change the radar data.
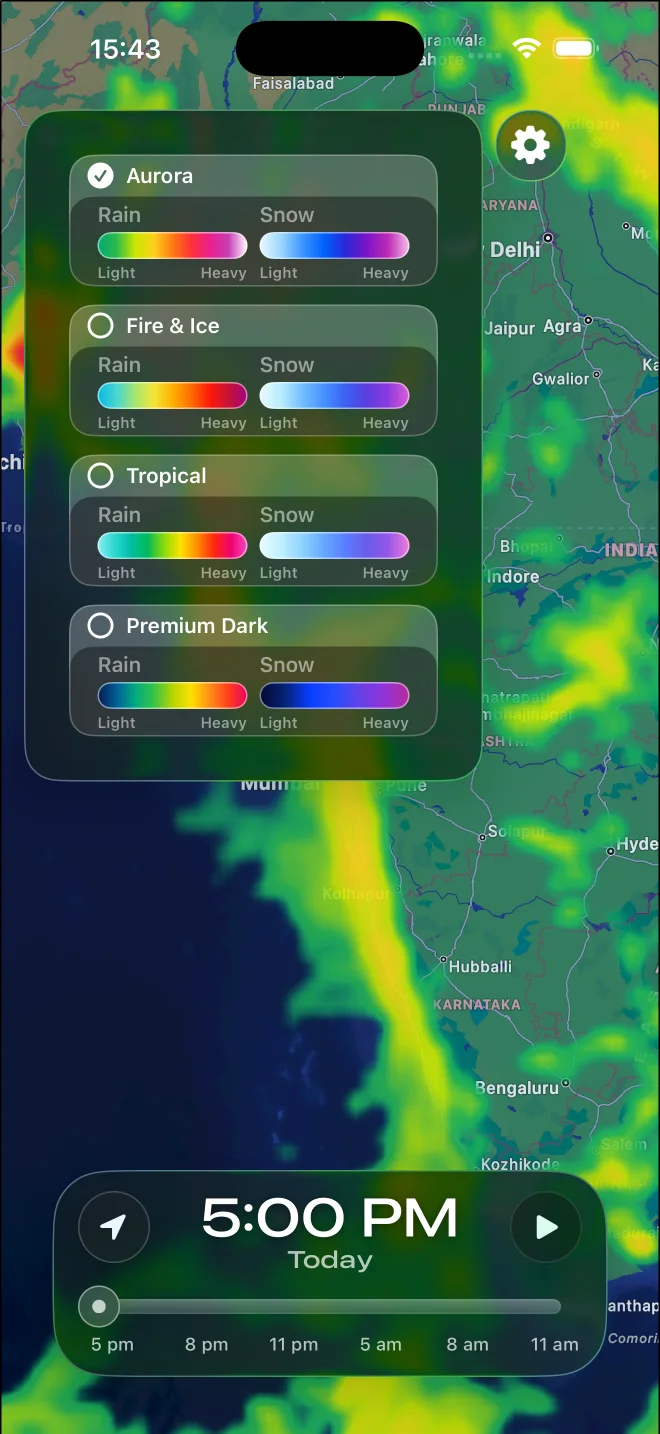
A palette maps numerical values to colors. Switching palettes can make boundaries or intensity differences easier to see, especially for people with different color-vision needs, but it does not create a new scan.
PocketRadar provides four radar palettes. Choose the scale you can distinguish most clearly, then keep using its legend as the reference.
Dry outside despite colored echoes?
Precipitation may be evaporating before it reaches the ground, or the return may come from clutter or another non-weather target. Read why radar can show rain when it is dry.
Put the method into practice
Compare intensity with a visible legend.
Open PocketRadar, pick a palette, and follow the same precipitation area across the animated timeline. Use color to compare relative intensity while movement shows where the echoes are going.