


Practical weather guide
Pocket RadarWhen will rain arrive? Read the radar loop
A single radar image shows where echoes were detected. Several timestamped images can help you estimate whether a rain area is approaching, when it might reach you, and how long it could last.
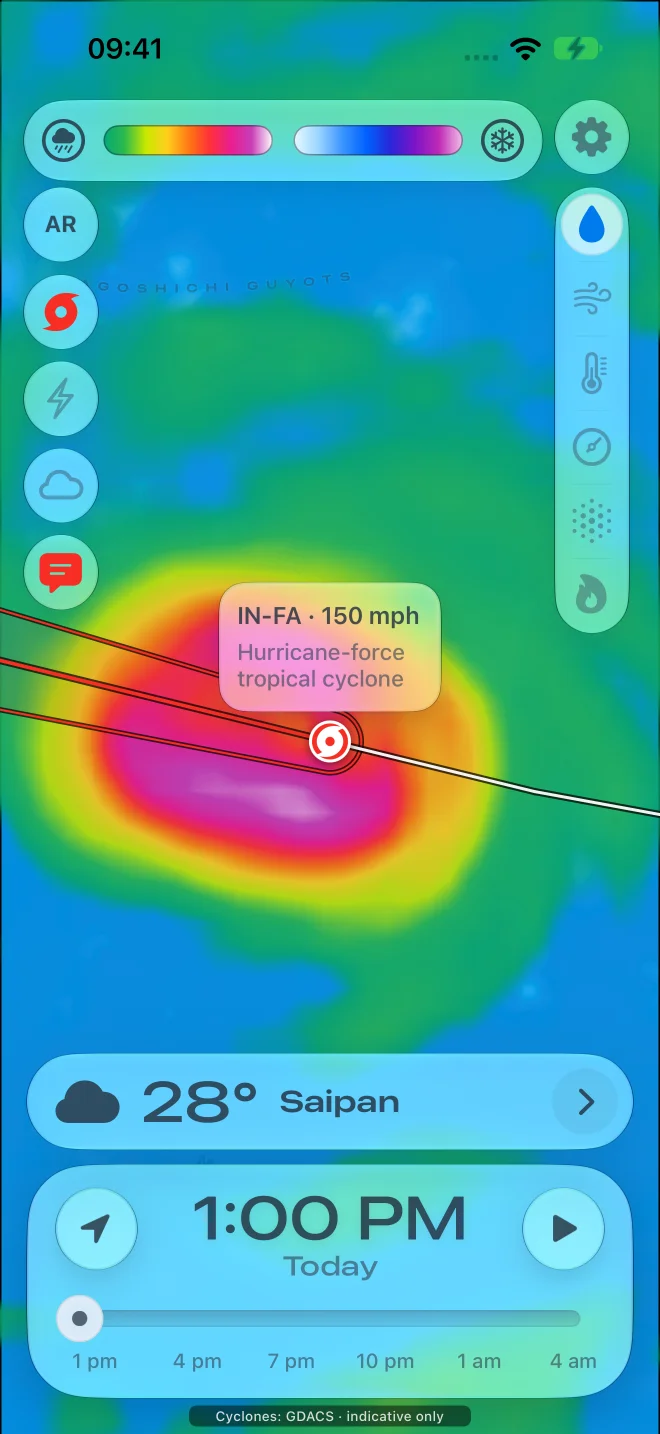
The quick method
Track the same edge of a rain area through several scans, estimate its speed, then divide its remaining distance along the direction of travel by that speed. Calculate from the image timestamp. This assumes the area keeps its shape, speed and direction; new or weakening showers can invalidate it.
Follow the same feature, using actual timestamps.
Mark your location and play several recent frames. Choose a recognizable leading edge or bend in a rain band. Check that it is moving toward your location rather than passing to one side. Avoid comparing unrelated bright pixels or assuming the nearest colored patch is approaching.
Read the elapsed time from the timestamps, not from how quickly the animation plays. Use the map scale or known distances between places to approximate movement. If the map has been zoomed between frames, compare it again at one consistent scale. A wind-speed reading is not a substitute for the measured motion of the rain area.
A worked example: 12 km in 20 minutes.
Suppose a recognizable rain edge moved 12 km between 14:00 and 14:20. Its estimated speed is 12 ÷ 20 = 0.6 km per minute, or 36 km/h. On the 14:20 image, the edge is 18 km away along its track toward you.
18 km ÷ 0.6 km/min = 30 minutes, giving an illustrative arrival near 14:50. If you are reading that image at 14:27, this is about 23 minutes from now, not another 30 minutes. Check for a more recent scan before relying on the estimate.
If plausible speeds range from 0.5 to 0.7 km/min, the same distance gives about 26–36 minutes after the scan: roughly 14:46–14:56. This is an arithmetic scenario, not a calibrated forecast or a confidence interval.
Use the trailing edge to estimate when rain may pass.
For a steady band crossing directly over you, measure its depth along the direction of travel. A band 9 km deep moving at 0.6 km/min would take about 15 minutes to pass a fixed point. In the example above, that suggests a possible end near 15:05.
Look behind the first band for additional showers. An empty gap between cells can mean a short pause rather than the end of the rain. A trailing edge that keeps rebuilding upstream may not arrive at the expected time.
Recognize when timing is unreliable.
Stop extending the simple calculation when cells form nearby, split, curve, grow or fade; the loop has missing or stale frames; terrain blocks radar coverage; or the edge is too diffuse to follow. Radar can detect precipitation aloft that does not reach the ground. See why a radar echo can appear when it is dry outside.
Rain timing is also different from hazard timing. Lightning and gusty outflow can affect an area before rain reaches it. For outdoor-event decisions, follow official forecasts, warnings and a safety plan rather than treating an estimated rain arrival as a safe-until time.
Keep three different times separate
| Time | In the example | What it means |
|---|---|---|
| Scan time | 14:20 | The time represented by the latest image |
| Time you view the map | 14:27 | The scan is already seven minutes old |
| Illustrative arrival | 14:50 | Thirty minutes after the scan, twenty-three after viewing |
Can radar tell me the exact minute?
A moving echo supports an estimate, not a promise. Recheck the next scan and the local forecast. A few frames of steady motion do not ensure the next half-hour will behave identically.
Does red mean rain will arrive sooner?
Color represents the selected map's intensity scale, not travel time. Read what radar colors and dBZ mean, then assess movement separately.
Compare the frames in Pocket Radar.
Use the precipitation map and timeline to inspect how rain areas move. Start with the five-step radar-reading guide if the map is unfamiliar. The calculations here are manual examples, not an automatic arrival-time feature.
Sources and method
The distance-and-speed examples are original illustrative calculations. The references below explain radar interpretation and why storm timing and hazard decisions need caution.