


Understand weather data
Pocket RadarWhat does AQI mean, and why do air-quality apps disagree?
Read an air-quality number together with its scale, pollutants, location and time. An index differs from a particle concentration. A forecast map and a nearby monitoring station are different sources.
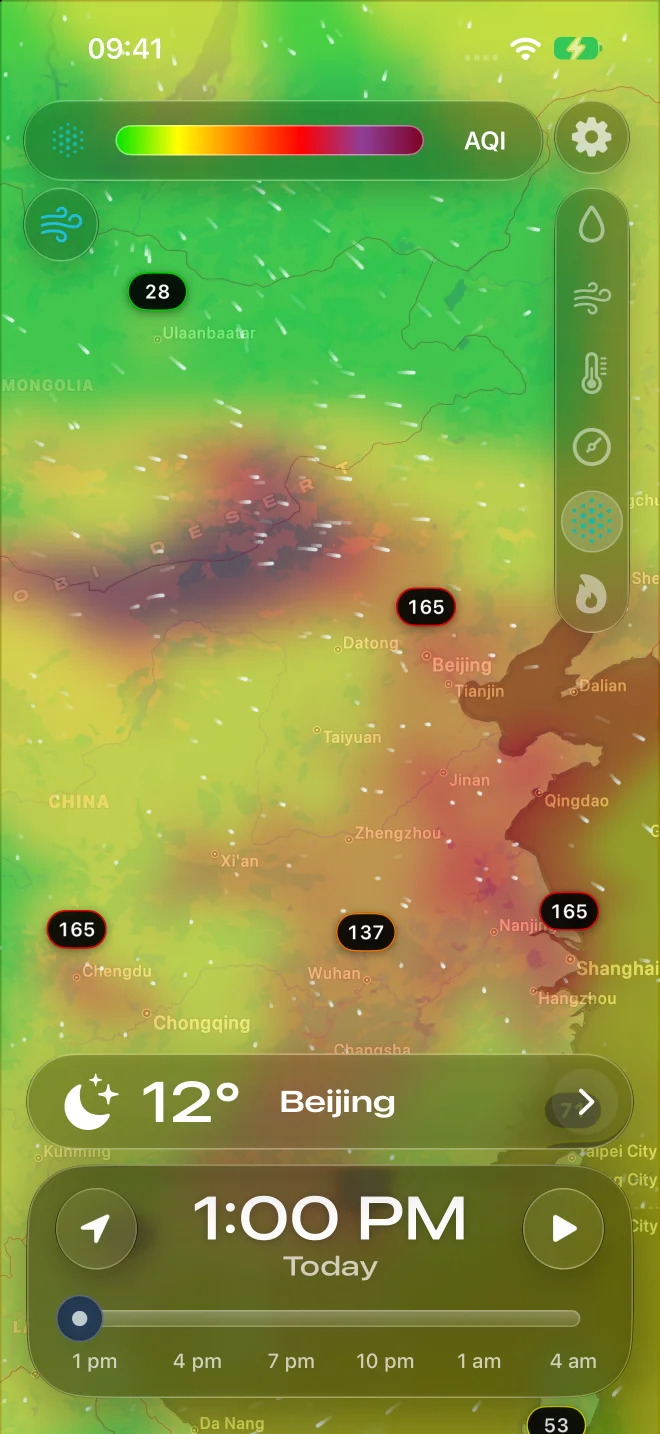
AQI is an index, not a percentage.
The U.S. Air Quality Index groups pollution into categories. A larger U.S. AQI means greater pollution concern. AQI 80 is not 80% polluted air and is not a particle concentration of 80 µg/m³. Read the named scale before comparing numbers.
See how the U.S. AQI colors work
EPA Regions explains AQI colors in the context of wildfire particle pollution. The video is in English; the complete written explanation is available in this page's language. The clip explains the U.S. scale, not the European index or Pocket Radar's data processing.
The same color does not always mean the same thing.
The U.S. AQI uses the ranges below. The European Air Quality Index uses different pollutant thresholds and six named levels. Its categories are not a second version of the U.S. 0–500 scale. Use each source's legend; a color alone is not a conversion rule.
| U.S. AQI | Category |
|---|---|
| 0–50 | Good |
| 51–100 | Moderate |
| 101–150 | Unhealthy for sensitive groups |
| 151–200 | Unhealthy |
| 201–300 | Very unhealthy |
| 301+ | Hazardous |
These are category names from the U.S. system. For actions appropriate to your location and circumstances, read the local environmental authority's guidance and alerts.
PM2.5, PM10 and AQI answer different questions.
PM2.5 and PM10 describe particle-size classes. A value in µg/m³ reports a mass concentration. AQI is calculated using pollutant-specific rules and averaging periods. You cannot copy a concentration into the AQI scale or convert every pollutant with one multiplier. Official U.S. particle AQI reporting uses daily averaging rules; AirNow's current reports can use its NowCast method.
An overall index can also reflect gases such as ozone. A particle-only map does not establish that those gases are low. Air can look clear while pollutants are present. Low cloud cover and an empty precipitation map do not establish good air quality.
Check four details before deciding which report is wrong.
Compare the scale, pollutant coverage, valid time and location. Then check whether each value is observed, modelled or forecast, and how long it averages. A station near a road and a broad model grid may describe different conditions even when both place names are the same.
Illustrative example: a model shows particle AQI 80 for an afternoon forecast, while a station reports an overall AQI of 110 for a different reporting period. Do not average them to 95 or call the difference a forecast error. First align the time, scale, pollutants and geographical source. The numbers are invented to demonstrate comparison, not live readings.
Use Pocket Radar for context, then check the source.
Pocket Radar offers air-quality maps alongside the weather. Its particle layers are estimates based on CAMS model fields for PM2.5 and PM10. The U.S. particle layer applies U.S. category boundaries to model values; the EU particle layer has six levels. These partial estimates are not official all-pollutant station AQI reports or an AirNow NowCast. Ozone and other gases are not included in those particle layers.
Read the selected layer's legend and frame time. Check local monitoring and official advisories when deciding what the air-quality situation means for your plans. For a separate weather question, see what radar colors and dBZ mean; radar reflectivity does not measure air pollution.
Read the map with its meaning attached.
Compare the air-quality layer, forecast time and weather in Pocket Radar. Availability and local accuracy depend on the source and region.